Martyn Egan
Researcher in Social Reproduction and Inequality
View My ORCID Profile | SSRN
Reproduction Regimes
Overview This project used data from the International Social Survey Programme to explore cross-country variation in perceptions towards social reproduction. The analysis followed a number of stages, from application of robust dimensionality reduction techniques, to geometric data analysis, and permutational inference, all conducted using R. The resulting article is currently under review.
1. Principal Component Analysis on the Polychoric Correlation Matrix
All active variables within the chosen dataset shared the same self-reported five-point Likert scale. For this reason PCA on the polychoric (rather than Pearson) correlation matrix was preferred.
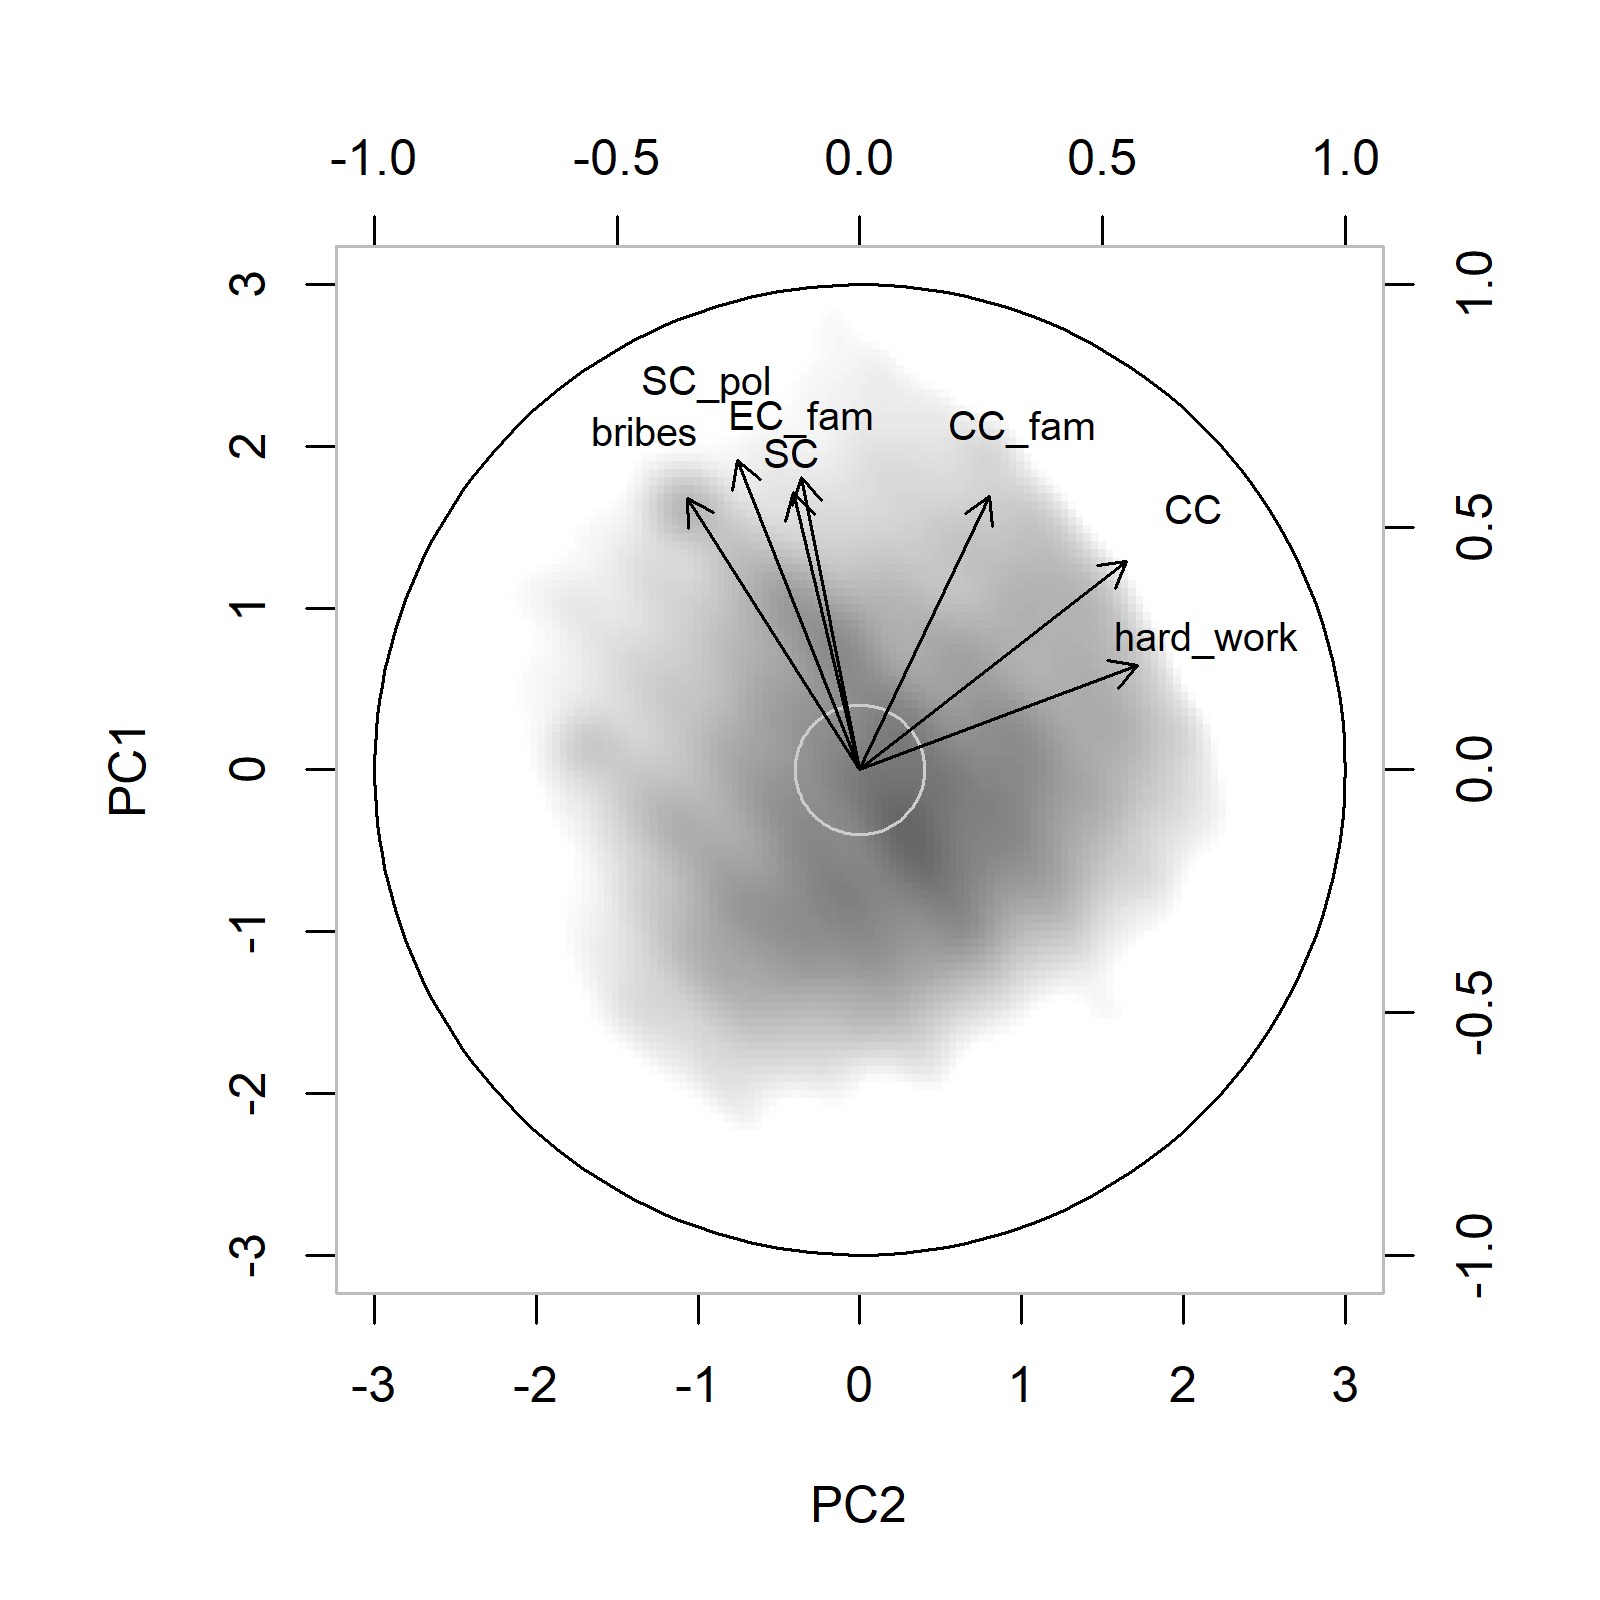
The above biplot was produced using a modified version of the plotone() function from the psych package in R (the original version only allows the density cloud to be plotted in blue).
An additional issue with PCA on the polychoric correlation matrix concerns estimation of row scores (i.e. coordinates) from component loadings. Because these are derived from an estimated, latent distribution, the observed data can no longer be used directly to calculate individuals’ coordinates. Instead, row scores are estimated using a regression weights matrix derived from the inverse of the correlation matrix multiplied by the component loadings (“Thurstone” method). The resulting ‘factor’ scores comply with usual expectations of uncorrelatedness between components, but are also standardised, with coordinates for each component having zero mean and unit variance.
2. Geometric Data Analysis
The coordinates derived from PCA were used to perform geometric data analysis (GDA), in which categories of data are used to generate concentration ellipses, and the distribution of the ellipses is then analysed.
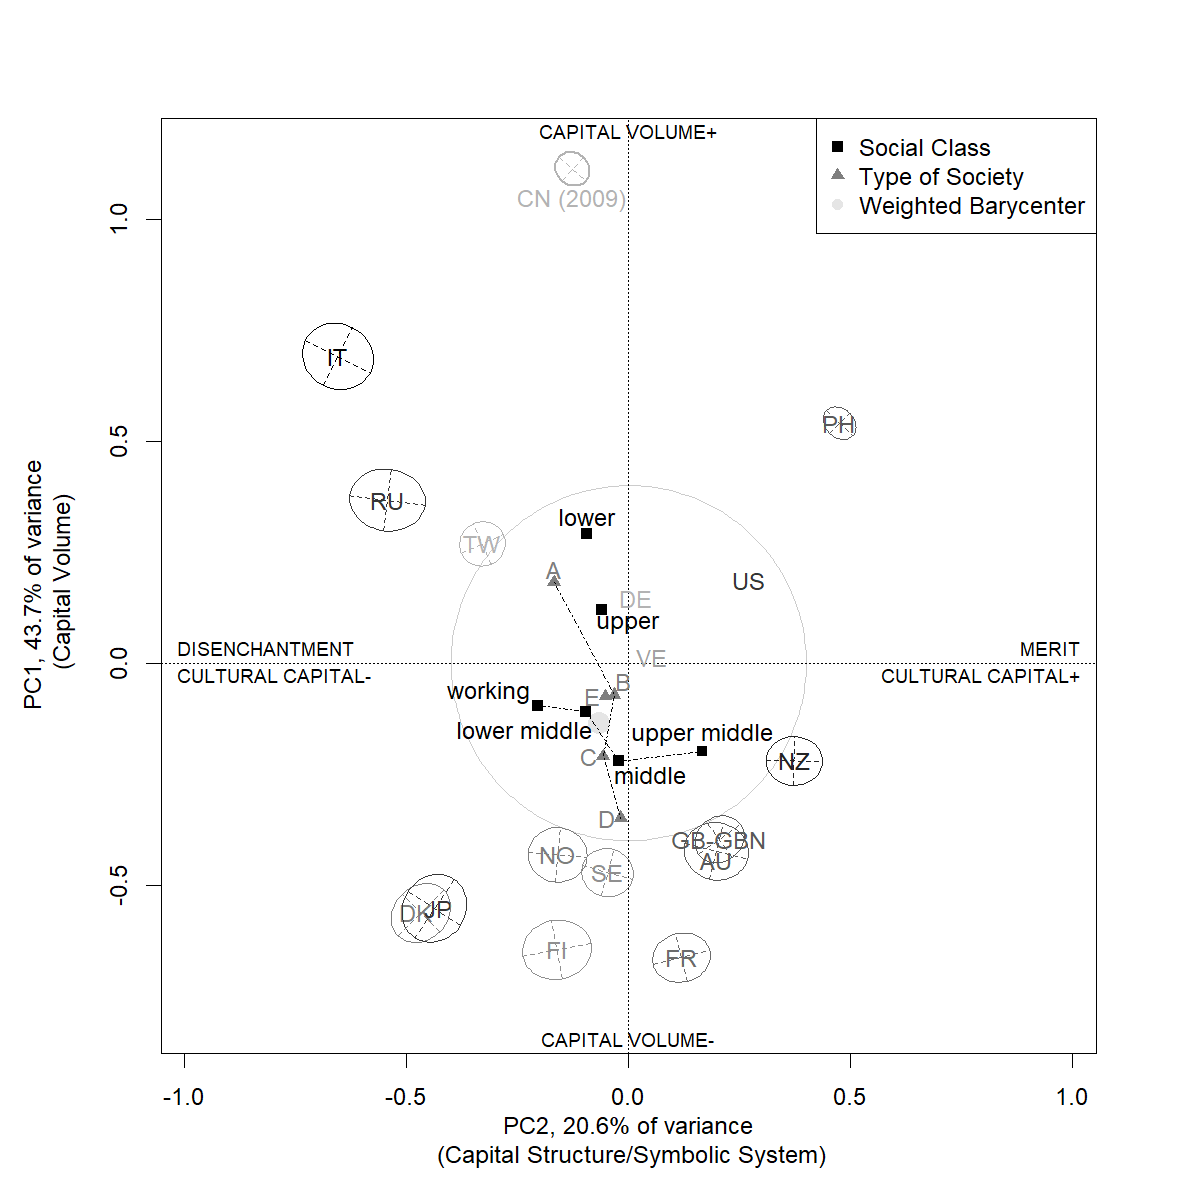
In the above plot, made using base R plotting functions, a number of simultaneous techniques are used to communicate information about the data:
- Compatibility ellipses are calculated according to the approach recommended by Le Roux et al., (2019), and which can be interpreted in a similar way to confidence intervals in inferential statistics.
- Minor and major axes of the ellipses are calculated and plotted to indicate orientation of the underlying cloud according to the principal components.
- An alpha gradiant transformation is applied to ellipses according to the squared cosine of the cloud on the second component (indicating which countries are better represented by that axis).
- Social class and perceived society type are plotted as structuring features to illustrate how these ordered categorical variables are distributed within the space.
- Aids to interpretation are provided by the light grey shaded circle at 0.4 (indicative of a meaningful distance, in terms of the Mahalanobis norm, from the origin), axis labels (dominant capitals, symbolic system), and a legend.
3. Deepening the Analysis
Alongside an exploration of the social space of reproduction, additional GDA techniques making use of combinatorial inference were applied to demonstrate the significance of the structures discovered. Among these were a crossed factors comparison of two countries, Great Britain (i.e. not including Northern Ireland) and Italy.
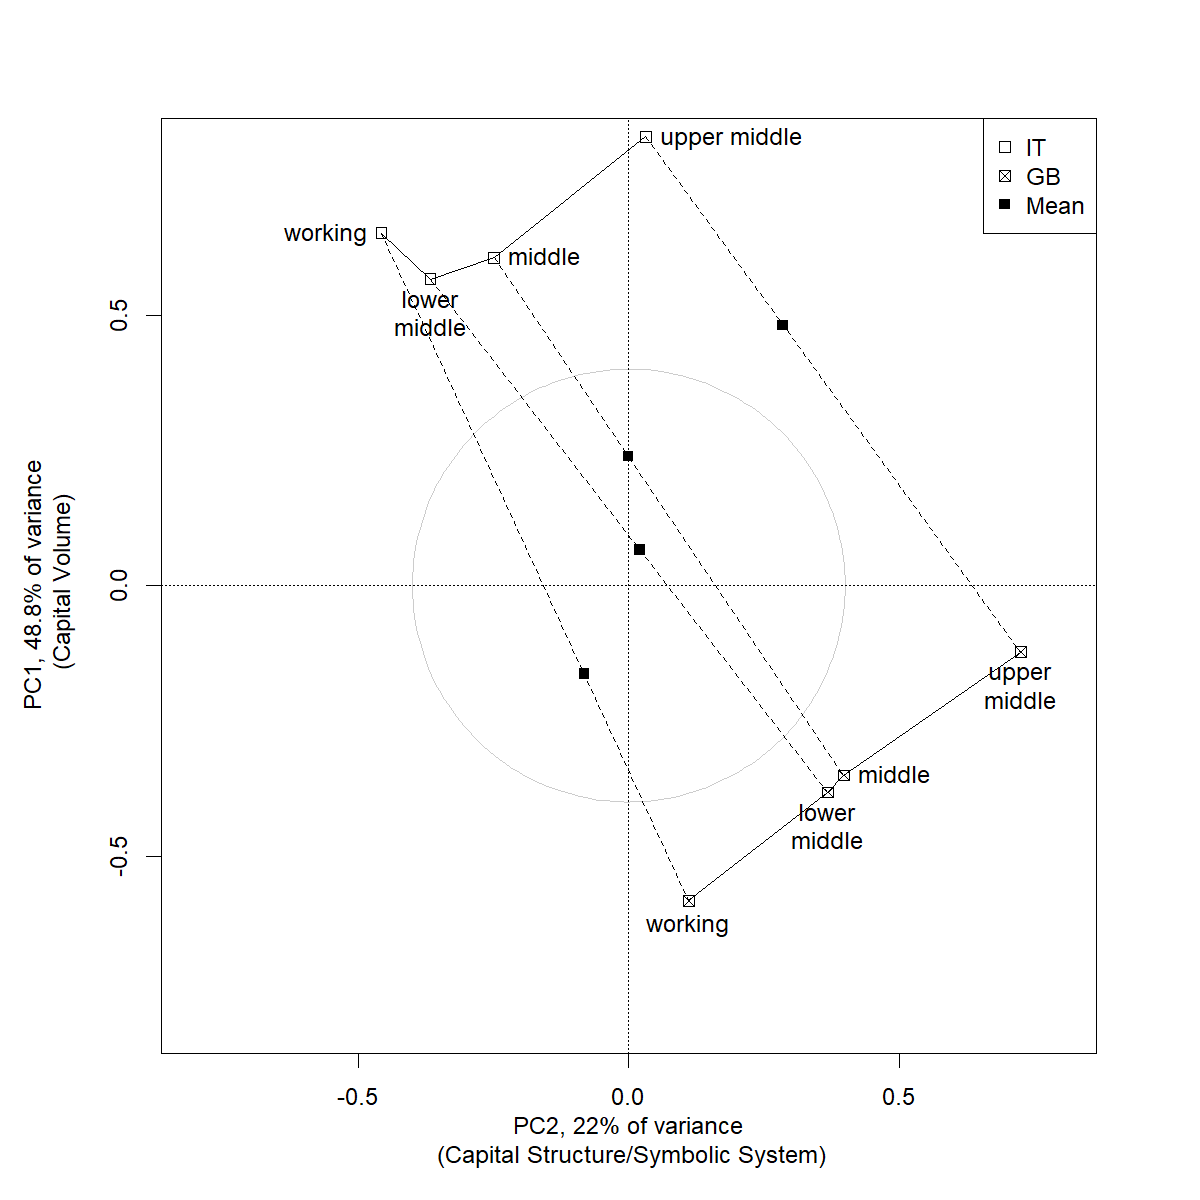
The above plot demonstrates the structuring effects of country and social class; when combined with a homogeneity permutation test (Le Roux et al., 2019:107-152), the resulting analysis demonstrated that the size of main effect attributable to country was descriptively much larger than class. We see moreover from the plot that, for these two countries, the effect of class and country is orthogonal.
References
Le Roux, B., Bienaise, S., & Durand, J.-L. (2019). Combinatorial Inference in Geometric Data Analysis. Boca Raton: CRC Press.